Fiscal FY05 / 2022 Presentation material (HTML) (2021.5.16 - 2022.5.15)

June 21, 2022

The Company's plans, business outlooks and strategies contained in this material are based on the judgment of the Company's management obtained from the information available as of the date of the announcement. It is just a future forecast, due to various risks and uncertainties such as intensifying price competition in the market, fluctuations in economic trends surrounding the business environment, large fluctuations in the market price in the capital market, and various uncertainties other than the above. Please be aware that the actual business results may differ significantly.

Index

◼ FY05/ FY05 / 2022 results overview ◼ FY05/ FY05 / 2023 plan

* The following abbreviations may be used in this document.
Fukutaro = Kusurino Fukutaro TGN = Tsuruha Group Drug & Pharmacy West Japan Lady = Lady Pharmacy
B & D = B & D Eleven = Drug Eleven TGMD = Tsuruha Group Merchandising
FY05 / 2022 Earnings Summary

Financial results highlights

Gross profit margin improved while sales and profits decreased

Results for the fiscal year ending May 2022 * The same period of the previous year includes the results for 11.5 months of Drug Eleven.

Sales of 915.7 billion yen
(down 0.4 % YoY on-year)

Operating income 40.5 billion yen
(down 16.1 % YoY on-year)

Business overview
  • Sales declined due to the year-on-year decline in existing store sales and customer numbers
  • 0.6 point improvement of gross profit margin due to increase in the number of prescriptions and the expansion of PB products 
  • The impact of soaring utility bills, including labor costs
    Expense control is going well

Main Initiatives in FY05 / 2022

Promotion of digital strategy

  • Acquisition of app members

    6.2 million downloads at the end of the period

  • Building and utilizing a customer database

    Tailored to the needs of individual customers
    1to1 marketing development started

  • Efforts to improve store operational efficiency

    Shift creation support system
    Digitization of cosmetics customer management

  • Started preparations for introducing in-house payments

Pursuing convenience in real stores

  • Promotion of line lobing

    Fresh food (meat, fruits and vegetables), 100 yen uniform

  • Responding to new purchasing styles

    Delivery service, BOPIS experiment

Promotion of dispensing business strategy

  • Promotion of new station opening

    Reached 30% of dispensing store composition

Sustainability promotion

  • Identification of important issues (materiality)
  • Development of environment-friendly PB products

Consolidated business results (compared to the plan)

Compared to the plan(million yen /%)

plan achievement
Composition ratio Composition ratio Plan ratio difference
amount of sales 956,000 100.0 915,700 100.0 95.8 ▲40,299
Gross profit 286,500 30.0 271,483 29.6 94.8 ▲15,016
SG&A expenses 235,300 24.6 230,914 25.2 98.1 ▲4,385
Operating income 51,200 5.4 40,568 4.4 79.2 ▲10,631
Ordinary profit 51,367 5.4 40,052 4.4 78.0 ▲11,314
Attribution to the shareholders of the parent company
Quarterly net income
28,280 3.0 21,388 2.3 75.6 ▲6,891
amount of sales
  • Existing store (13 months old store) YoY
    Plan +2.3% → Actual -1.0%
  • 159 new stores
Gross profit
  • Not achieved due to sales budget difference
  • Impact of inventory evaluation review of corona-related products (disinfectants, etc.)
Selling, general and administrative expenses
  • Landing within budget due to control of labor costs, etc.
  • Increased utility bills

Consolidated business results (year-on-year)

Compared to the previous year  * The same period of the previous year includes the results for 11.5 months of Drug Eleven (million yen /%)

Year-on-year achievement
achievement Composition ratio Composition ratio YoY
amount of sales 919,303 100.0 915,700 100.0 99.6
Gross profit 266,721 29.0 271,483 29.6 101.8
SG&A expenses 218,344 23.7 230,914 25.2 105.8
Operating income 48,377 5.4 40.568 4.4 83.9
Ordinary profit 47,708 5.5 40,052 4.4 84.0
Attribution to the shareholders of the parent company
Net income
26,318 3.3 21,388 2.3 81.4

 (One million yen / %)

[Reference] Approximately based on the old standard
Composition ratio YoY
amount of sales 942,052 100.0 102.5
Gross profit 278,088 29.5 104.3
SG&A expenses 237,682 25.2 108.9
Operating income 40,405 4.3 83.5
Ordinary profit 40,009 4.2 83.6

[Reference] Impact of changes in revenue recognition standards

Full year(million yen /%)

FY05 / 2021 Before reclassification
(Old standard base)
After rearrangement
(Based on new standards)
Composition ratio Composition ratio YoY Composition ratio
amount of sales 919,303 100.0 942,052 100.0 102.5 915,700 100.0
Gross profit 266,721 29.0 278,088 29.5 104.3 271,483 29.6
SG&A expenses 218,344 23.7 237,682 25.2 108.9 230,914 25.2
Of which, sales promotion expenses 5,948 0.6 10,915 1.2 183.5 4,147 0.5
Operating income 48,377 5.3 40,405 4.3 83.9 40,568 4.4

Impact of recombination

  • Own points The amount granted is
    Change from recording provision for provision to deferring recording of revenue
  • Other companies' points The amount granted is
    Change from expense recording to reduction of transaction price
  • Digestion purchase Revenue recognition
    Change from total to net
(Unit: million yen)

Sales △ 26,352

Own points granted△ 4,904
Other companies' points awarded△ 1,654
Digestion purchase (consignment sales, etc.)△ 19,794

Cost of sales △ 19,747

Digestion purchase (consignment sales, etc.)△ 19,747

SG & A expenses △ 6,768

Own points granted△ 5,114
Other companies' points awarded△ 1,654

Gross profit △ 6,605

Consolidated business results (year-on-year) excluding Drug Eleven

Year-on-year comparison(million yen /%)

Year-on-year achievement
achievement Composition ratio Composition ratio YoY
amount of sales 872,290 100.0 872,040 100.0 100.0
Gross profit 253,424 29.1 258,309 29.6 101.9
SG&A expenses 205,454 23.6 217,576 25.0 105.9
Operating income 47,969 5.5 40,733 4.7 84.9
Ordinary profit 47,454 6.0 40,311 4.6 84.9
Attribution to the shareholders of the parent company
Net income
26,745 3.1 22,102 2.5 82.6

  (One million yen / %)

Old standard base estimate
Composition ratio YoY
amount of sales 897,777 100.0 102.9
Gross profit 264,474 29.5 104.4
SG&A expenses 223,902 24.9 109.0
Operating income 40,573 4.5 84.6
Ordinary profit 40,151 4.5 84.6
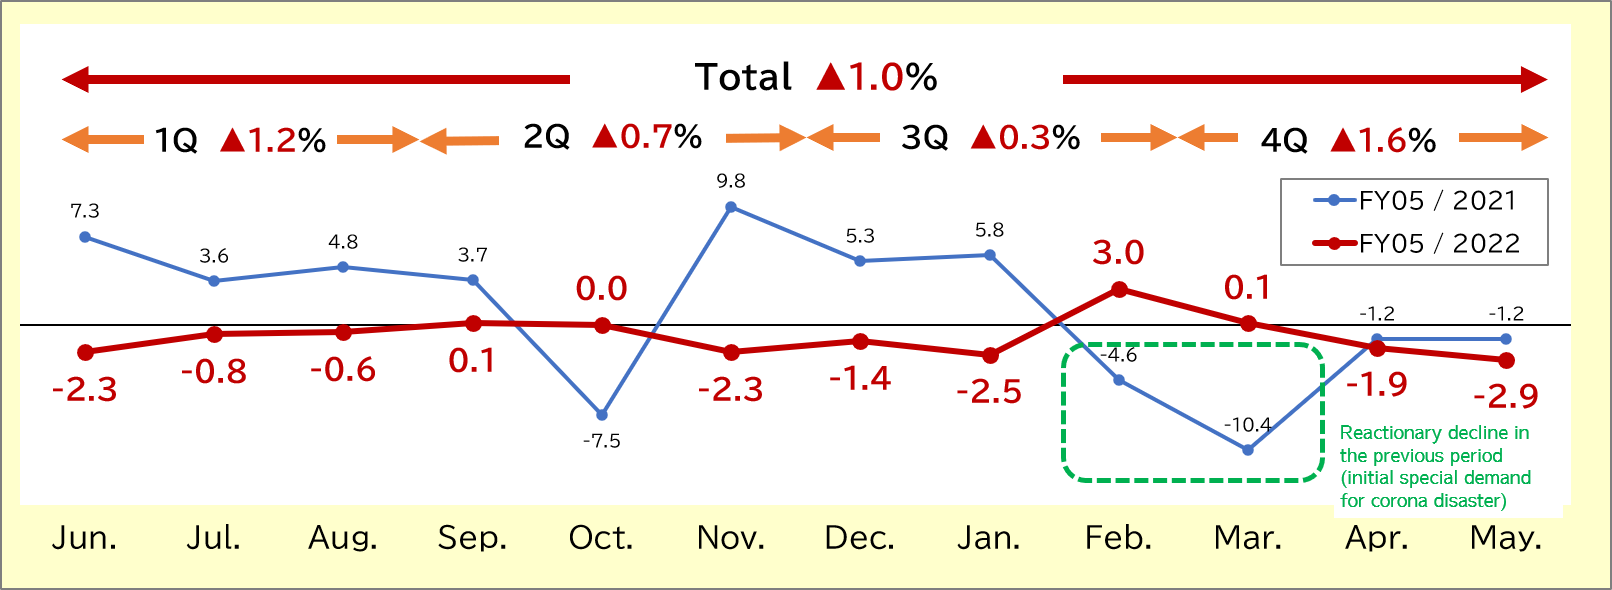
  • Sales at existing stores (13 months old)-1.0 % YoY (4Q-1.6 %)

Consolidated business results (quarterly trend)

Current term(million yen /%)

the 1st quarter the 2nd quarter the 3rd quarter Fourth quarter
achievement Composition ratio YoY achievement Composition ratio YoY achievement Composition ratio YoY achievement Composition ratio YoY
amount of sales 235,684 100.0 104.9 226,827 100.0 99.1 229,377 100.0 99.5 223,810 100.0 95.1
Gross profit 69,126 29.3 106.2 67,690 29.8 101.7 68,582 29.9 103.3 66,083 29.5 96.2
SG&A expenses 56,237 23.9 112.7 57,870 25.5 107.7 57,241 25.0 104.7 59,565 26.6 99.2
Operating income 12,889 5.5 85.0 9,820 4.3 76.5 11,340 4.9 96.8 6,517 2.9 75.2
Ordinary profit 12,944 5.5 84.4 9,678 4.3 74.4 11,302 4.9 102.7 6,127 2.7 73.4
Attribution to the shareholders of the parent company
Net income
7,536 3.2 82.5 5,203 2.3 69.8 6,163 2.7 103.3 2,485 1.1 66.7

Previous term(million yen /%)

Drug Eleven 3 months included Drug Eleven 3 months included Eleven 5.5 months included
the 1st quarter the 2nd quarter the 3rd quarter Fourth quarter
achievement Composition ratio YoY achievement Composition ratio YoY achievement Composition ratio YoY achievement Composition ratio YoY
amount of sales 224,623 100.0 107.6 228,869 100.0 110.2 230,421 100.0 110.2 235,388 100.0 109.3
Gross profit 65,076 29.0 108.8 66,556 29.1 111.3 66,399 28.8 108.7 68,688 29.2 108.1
SG&A expenses 49,913 22.2 105.8 53,720 23.5 110.4 54,688 23.7 113.1 60,021 25.5 109.0
Operating income 15,162 6.8 120.1 12,835 5.6 115.2 11,711 5.1 91.7 8,667 3.7 102.2
Ordinary profit 15,328 6.8 119.1 13,001 5.7 112.4 11,007 4.8 84.9 8,350 3.5 93.9
Attribution to the shareholders of the parent company
Net income
9,137 4.1 104.7 7,450 3.3 109.1 5,968 2.6 77.0 3,727 1.6 81.1

[Reference] Consolidated financial results (quarterly trends) Excluding Drug Eleven

Approximate current / old standard base(million yen /%)

the 1st quarter the 2nd quarter Third quarter Fourth quarter
achievement Composition ratio YoY achievement Composition ratio YoY achievement Composition ratio YoY achievement Composition ratio YoY
amount of sales 229,596 100 102.2 222,482 100 103 225,695 100 103.4 220,004 100 103.1
Gross profit 66,992 29.2 102.9 66,194 29.8 105.1 66,955 29.7 106.4 64,333 29.2 103.1
SG&A expenses 54,144 23.6 108.5 56,183 25.3 111.8 55,869 24.8 109.1 57,706 26.2 106.7
Operating income 12,848 5.6 84.7 10,011 4.5 78.5 11,086 4.9 94.3 6,628 3 79.8
Ordinary profit 12,924 5.6 84.3 9,869 4.4 76.4 11,077 4.9 100.5 6,281 2.9 76.8

Previous term(million yen /%)

the 1st quarter the 2nd quarter the 3rd quarter Fourth quarter
achievement Composition ratio YoY achievement Composition ratio YoY achievement Composition ratio YoY achievement Composition ratio YoY
amount of sales 224,623 100.0 107.6 215,923 100.0 104.0 218,333 100.0 104.4 213,411 100.0 99.1
Gross profit 65,076 29.0 108.8 62,995 29.2 105.4 62,951 28.8 103.0 62,401 29.2 98.2
SG&A expenses 49,913 22.2 105.8 50,244 23.3 103.3 51,199 23.4 105.9 54,098 25.3 98.2
Operating income 15,162 6.8 120.1 12,751 5.9 114.5 11,753 5.4 92.1 8,303 3.9 97.9
Ordinary profit 15,328 6.8 119.1 12,923 6.0 111.7 11,025 5.0 85.0 8,177 3.8 92.0

SG&A expenses (compared to the previous year)

Consolidated* The same period of the previous year includes the results for 11.5 months of Drug Eleven (million yen /%)

FY05 / 2021 FY05 / 2022
YoY YoY
Labor costs Amount of money 110,464 109.0 115,617 104.7
Sales ratio 12.0 △0.1 12.6 +0.6
Sales promotion expense Amount of money 5,948 108.1 4,147 69.7
Sales ratio 0.6 △0.1 0.5 △0.1
Land rent, etc. Amount of money 48,339 108.3 50,381 104.2
Sales ratio 5.3 0.0 5.5 +0.2
other expenses Amount of money 53,592 112.3 60,768 113.4
Sales ratio 5.8 +0.1 6.6 +0.8
SG&A expenses Amount of money 218,344 109.6 230,914 105.8
Sales ratio 23.8 +0.1 25.2 +1.4

Excluding Drug Eleven(million yen /%)

FY05 / 2022 FY05 / 2022
(approximate based on old standards)
YoY YoY
Labor costs Amount of money 109,558 104.9 109,558 104.9
Sales ratio 12.6 +0.6 12.2 +0.2
Sales promotion expense Amount of money 3,693 66.9 10,019 181.4
Sales ratio 0.4 △0.2 1.1 +0.5
Land rent, etc. Amount of money 47,504 104.6 47,504 104.6
Sales ratio 5.4 +0.2 5.3 +0.1
other expenses Amount of money 56,819 113.5 56,819 113.5
Sales ratio 6.5 +0.8 6.3 +0.6
Selling costs·
General and administrative expenses
Amount of money 217,576 105.9 223,902 109.0
Sales ratio 25.0 +1.4 24.9 +1.3
  • Personnel expenses…Control over the full year, control compared to the YoY
  • Other expenses ... Utility expenses (Electricity charges) Year-on-year increase of 1.8 billion yen,
    Increase in cashless fees and depreciation costs

Achievements by company

Year-to-date *Since the consolidated period for Drug Eleven differs from the previous fiscal year,
Year-on YoY changes are not shown.

consolidated Tsuruha Kusurino Fukutaro Tsuruha Group Drug &
Pharmacy West Japan
Lady drug store Kyorindo Pharmacy B & D Drug Eleven
YoY YoY YoY YoY YoY YoY YoY YoY
amount of sales Amount of money 915,700 99.6 441,280 99.4 71,117 98.4 127,605 101.2 79,599 101.0 117,230 101.8 28,396 95.0 44,033
Sales ratio 100.0 100.0 100.0 100.0 100.0 100.0 100.0 100.0
Gross profit Amount of money 271,483 101.8 132,789 101.0 23,423 99.0 38,577 104.4 22,768 101.6 29,803 105.9 8,234 98.8 13,547
Sales ratio 29.6 +0.6 30.1 +0.5 32.9 +0.1 30.2 +0.9 28.6 +0.2 25.4 +1.0 29.0 +1.1 30.8
SG&A expenses Amount of money 230,914 105.8 112,544 107.2 21,091 100.8 28,384 107.8 18,081 102.6 25,017 107.4 7,384 97.2 13,138
Sales ratio 25.2 +1.4 25.5 +1.9 29.7 +0.7 22.2 +1.3 22.7 +0.3 21.3 +1.1 26.0 +0.6 29.8
Operating income Amount of money 40,568 83.9 20,244 76.2 2,332 84.9 10,193 95.8 4,687 98.1 4,785 98.5 850 115.4 408
Sales ratio 4.4 △0.9 4.6 △1.4 3.3 △0.5 8.0 △0.4 5.9 △0.2 4.1 △0.1 3.0 +0.5 0.9
Ordinary profit Amount of money 40,052 84.0 20,587 77.8 1,814 65.0 10,335 98.2 4,366 94.0 4,634 99.7 949 134.4 334
Sales ratio 4.4 △0.8 4.7 △1.3 2.6 △1.3 8.1 △0.2 5.5 △0.4 4.0 0.0 3.3 +0.9 0.8
Attribution to the shareholders of the parent company
Net income
Amount of money 21,388 81.4 13,795 79.6 795 53.6 6,889 97.6 2,691 87.5 3,242 104.9 588 141.6 23
Sales ratio 2.3 △0.6 3.1 △0.8 1.1 △1.0 5.4 △0.2 3.4 △0.5 2.8 +0.1 2.1 +0.7 0.1

Results by company (estimate based on old standards)

Full-year cumulative estimate based on old standards *Since the consolidated period for Drug Eleven differs from the previous fiscal year,
Year-on YoY changes are not shown.

consolidated Tsuruha Kusurino Fukutaro Tsuruha Group Drug &
Pharmacy West Japan
Lady drug store Kyorindo Pharmacy B & D Drug Eleven
YoY YoY YoY YoY YoY YoY YoY YoY
amount of sales Amount of money 942,052 102.5 453,062 102.0 72,252 100.0 133,040 105.5 80,900 102.6 122,653 106.5 29,055 97.2 44,544
Sales ratio 100.0 100.0 100.0 100.0 100.0 100.0 100.0 100.0
Gross profit Amount of money 278,088 104.3 135,782 103.3 24,145 102.0 39,643 107.2 23,420 104.5 30,364 107.9 8,402 100.9 13,884
Sales ratio 29.5 +0.5 30.0 +0.4 33.4 +0.6 29.8 +0.5 28.9 +0.5 24,8 +0.4 28.9 +1.0 31.2
Selling costs·
General and administrative expenses
Amount of money 237,682 108.9 115,575 110.1 21,844 104.4 29,505 112.1 18,761 106.4 25,582 109.9 7,558 99.5 13,478
Sales ratio 25.2 +1.5 25.5 +1.9 30.2 +1.2 22.2 +1.3 23.2 +0.8 20.9 +0.8 26.0 +0.6 30.3
Operating income Amount of money 40,405 83.9 20,206 76.1 2,302 83.8 10,139 95.3 4,660 97.5 4,782 98.5 845 114.8 406
Sales ratio 4.3 △1.0 4.5 △1.5 3.2 △0.6 7.6 △0.8 5.8 △0.3 3.9 △0.3 2.9 +0.4 0.9
Ordinary profit Amount of money 39,889 83.6 20,549 77.7 1,784 60.0 10,281 97.6 4,339 93.4 4,631 99.7 944 133.7 332
Sales ratio 4.2 △1.3 4.5 △1.5 2.5 △1.4 7.7 △0.6 5.4 △0.5 3.8 △0.2 3.2 +0.8 0.7

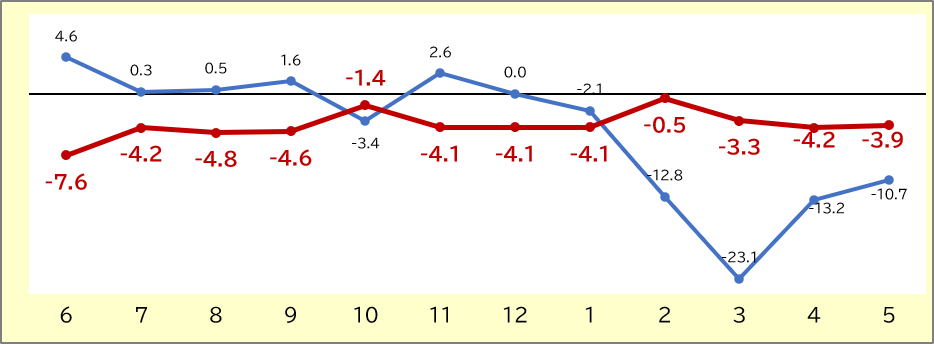
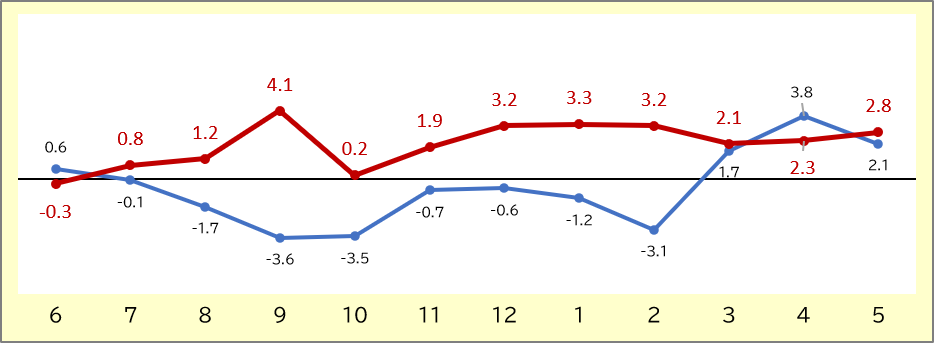
Year-on-year changes in sales (stores 13 months old) Excluding Drug Eleven

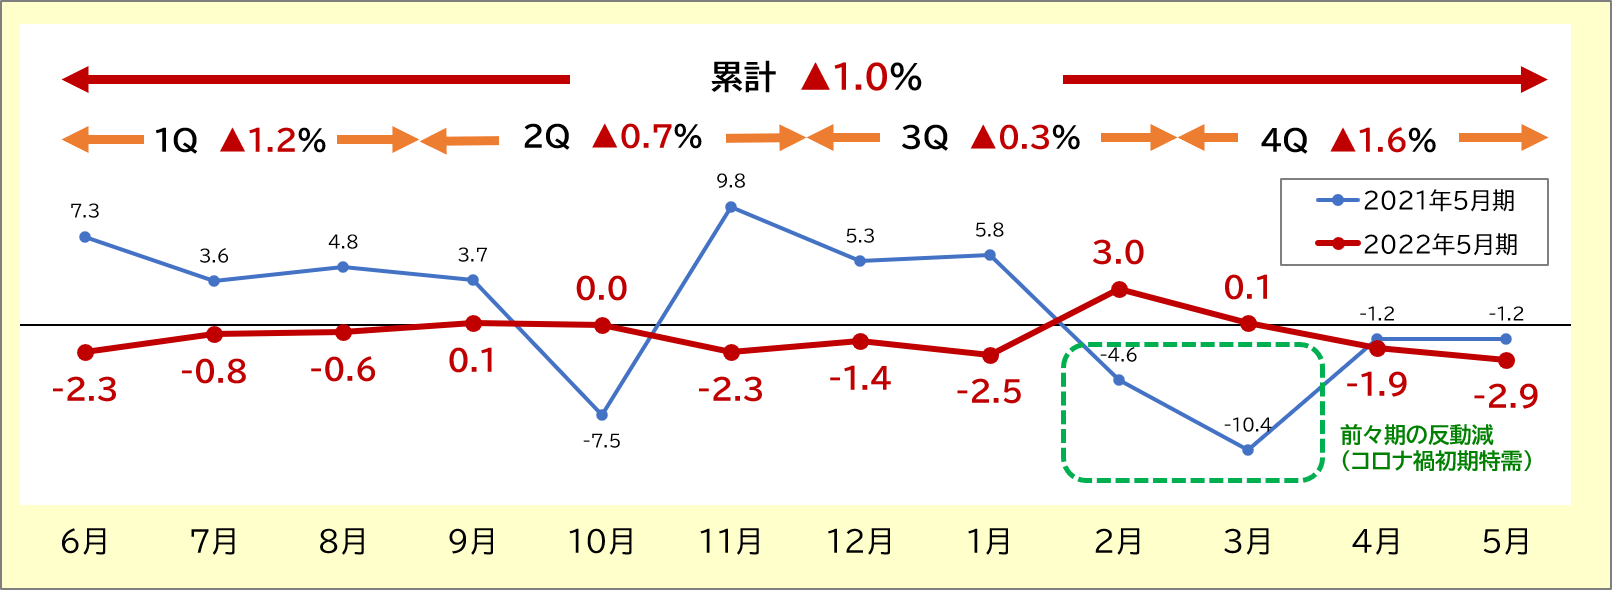
Month Jun. July Jul. August Aug. September Sep. October Oct. November Nov. December Dec. January Jan. February Feb. March Mar. April Apr. in May May.
 previous fiscal year
  • Demand for nesting after a state of emergency
  • Reactionary decrease / increase in reactionary increase in consumption tax increase in the previous term
  • Reactionary decline in mask demand in the previous term
  • Reactionary decline in demand for nesting in the previous term
  • Increased demand due to the third wave
  • Demand for infection control has subsided, demand for cold medicine has decreased
Current term
  • Reactionary decline in demand for nesting in the previous term
  • Slump in seasonal products such as cold remedies

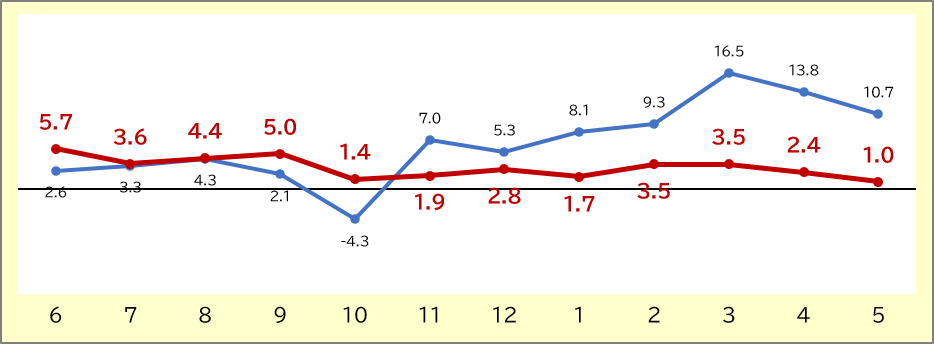
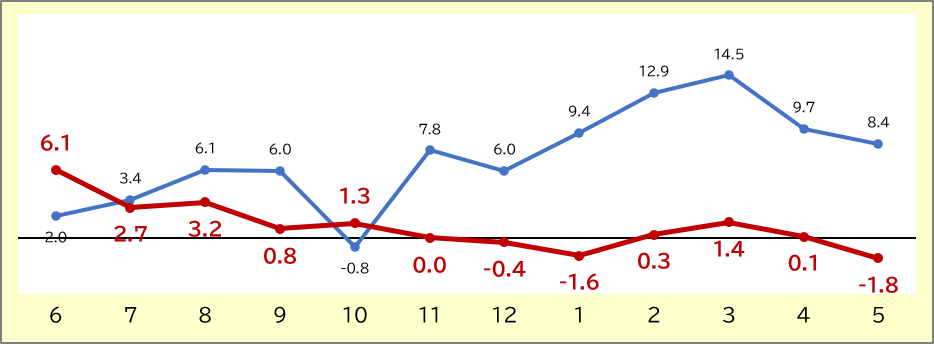
Sales analysis (stores 13 months old) Excluding Drug Eleven

Cumulative number of customers▲ 4.0 % ・ 3Q ▲ 3.8 %

Cumulative product unit price2.0 % / 3Q + 2.4 %

Cumulative customer unit price+ 3.1 % ・ 3Q + 2.3 %

Cumulative purchase points+ 1.0 % ・ 3Q ▲ 0.1 %

FY05 / 2021
FY05 / 2022

Store openings / closures / sales status by company

Number of stores

  End of the previous fiscal year Current term
Opening closed Net increase End of the quarter
Tsuruha 1,305 100 23 +77 1,382
Kusurino Fukutaro 233 5 6 △1 232
TGN 298 26 7 +19 317
Lady drug store 228 11 4 +7 235
Kyorindo Pharmacy 87 5 - +5 92
B & D 69 5 1 +4 73
Drug Eleven 199 7 16 △9 190
TGMD (EC Headquarters) 1 - - 0 1
Domestic total 2,420 159 57 +102 2,522

Existing store sales

Existing store sales YoY
 previous fiscal year Current term
Tsuruha 99.8 97.6
Kusurino Fukutaro 98.1 99.4
TGN 105.8 100.3
Lady drug store 105.2 101.2
Kyorindo Pharmacy 101.2 102.3
B & D 99.4 94.7
Drug Eleven * Treated as a new store during this term
Domestic total 101.1 99.0
  • 94 new dispensing stores
  • Renovation of existing stores 241 stores

Store openings / closures / sales status by region

Number of stores

  End of the previous fiscal year Current term
Opening closed Net increase End of the quarter
Hokkaido 414 16 8 +8 422
Tohoku 533 40 3 +37 570
Kanto Koshinetsu 493 37 10 +27 520
Chubu / Kansai 237 18 8 10 247
China 315 20 9 +11 326
Shikoku 212 14 6 +8 220
Kyushu / Okinawa 216 14 13 +1 217
Domestic total 2,420 159 57 +102 2,522
(5 other FC stores)
Overseas (Thailand) 22 1 6 △5 17

Existing store sales

Existing store sales YoY
 previous fiscal year Current term
Hokkaido 100.5 98.4
Tohoku 101.4 97.2
Kanto Koshinetsu 99.6 98.0
Chubu / Kansai 97.7 100.6
China 106.0 100.2
Shikoku 103.9 100.9
Kyushu 108.7 103.6
total 101.1 99.0
* Drug Eleven is not included in existing stores

Results by product group (cumulative for the current period)

* In the same period of the previous year, the results for 11.5 months of Drug Eleven are included (million yen /%).

amount of sales Earnings
Gross profit margin
YoY Composition ratio YoY increase / decrease
Product Pharmaceuticals 201,259 103.9 22.0 42.2 △0.1
Dispensing 102,871 110.6 11.2 38.8 △0.2
OTC 98,387 97.7 10.7 45.7 +0.5
Cosmetics 130,328 97.7 14.2 32.4 △0.9
Daily goods 249,129 95.7 27.2 28.0 +1.1
Food 220,346 103.5 24.1 15.9 +1.5
others 110,526 95.9 12.1 33.7 +0.9
Product total 911,590 99.6 99.6 29.5 +0.6
total 915,700 99.6 100.0 29.6 +0.6

Results by product group (cumulative for the current period) Excluding Drug Eleven

Excluding eleven ・ Approximately based on the old standard (million yen /%)

amount of sales Gross profit margin
YoY Composition ratio YoY increase / decrease
Product Pharmaceuticals 194,326 105.3 21.6 42.3 △0.1
Dispensing 100,614 110.8 11.2 38.6 △0.3
OTC 93,712 99.9 10.4 46.3 +0.6
Cosmetics 124,227 100.6 13.8 34.5 +1.0
Daily goods 247,264 101.0 27.5 27.7 +0.3
Food 224,804 107.1 25.0 14.8 +0.4
others 103,025 97.5 11.5 34.1 +1.5
Product total 893,649 102.9 99.6 29.3 +0.4
total 897,580 102.9 100.0 29.4 +0.4
Pharmaceuticals
  • Good performance throughout the year of dispensing
  • Increased demand for antipyretic analgesics
Cosmetics
  • Sales gradually recover mainly on general cosmetics
Daily goods
  • Corona product inventory valuation review
    Temporary decline in gross margin

Breakdown of product group "Other"

Sales * POS base
YoY Total for products
Composition ratio
healthy food 30,599 101.8 3.4
Medical supplies / long-term care 52,073 94.8 5.8
Childcare products 19,524 96.8 2.2

Dispensing department results

Consolidated* The same period of the previous year includes the results for 11.5 months of Drug Eleven(million yen /%)

Cumulative period This quarter
Year-on-year
Actual results
achievement YoY Year-on-year
Actual results
achievement YoY
Dispensing fee (million yen) 93,029 102,871 110.6 24,734 26,177 105.8
Gross profit margin (%) 39.0 38.8 △0.2 38.4 38.3 △0.1
Number of prescriptions (thousands) 8,650 9,575 110.7 2,299 2,402 104.5
Unit price (yen) 10,754 10,744 99.9 10,757 10,896 101.3

Excluding Drug Eleven

Cumulative period This quarter
Year-on-year
Actual results
achievement YoY Year-on-year
Actual results
achievement YoY
Dispensing fee (million yen) 90,788 100,614 110.8 24,151 25,630 106.1
Gross profit margin (%) 38.9 38.6 △0.3 38.2 38.2 0.0
Number of prescriptions (thousands) 8,361 9,276 110.9 2,223 2,330 104.8
Unit price (yen) 10,858 10,846 99.9 10,861 11,000 101.3

Number of dispensing stores by company

  End of the previous fiscal year End of the quarter (breakdown)
Annex Specialty
Tsuruha 310 343 303 40
Medicine
Fukutaro
104 121 62 59
TGN 103 113 90 23
Lady drug store 55 59 34 25
Kyorindo Pharmacy 67 73 60 13
B & D 24 30 23 7
drag
Eleven
20 23 13 10
Domestic total 683 762 585 177

Reaction to the previous year's restraint of consultation and
Due to the increase in the number of pharmacies Increased number of prescriptions

PB product performance (cumulative for the full year)

Excluding full-year cumulative Drug Eleven (million yen /%)

Sales (million yen) Sale composition ratio(%)
* Product sales excluding dispensing
Gross profit margin (%)
Year-on-year achievement YoY achievement YoY increase / decrease achievement YoY increase / decrease
Kurashi-Rhythm
series
24,484 37,068 151.4 4.7 +1.5 47.1 +0.7
M's One
Medis One
16,933 8,102 47.8 1.0 △1.2 33.4 △5.4
subtotal 41,417 45,170 109.1 5.7 +0.4 44.7 +1.4
Exclusive products
Company limited product
25,082 27,477 109.5 3.5 +0.3 39.6 △2.7
total 66,499 72,648 109.2 9.2 +0.6 42.8 △0.1
Including eleven
total
75,448 9.1 43.2

 (One million yen / %)

Number of SKUs
Kurashi-Rhythm
series
M's One
Medis One
Exclusive products
Company limited product
total
Pharmaceuticals 130 12 578 720
Cosmetics 82 10 175 267
Daily necessities 350 38 346 734
Food 21 92 615 728
health
Food
72 0 138 210
medical care
Supplies
227 34 94 355
Childcare
Supplies
8 0 10 18
Total 890 186 1,956 3,032
  • Kurashi-Rhythm Series Term End 890 SKU 
    Increased by 150 SKU mainly for daily necessities and healthcare
  • Total PB sales composition ratio 9.1% 
    * 9% level since the fiscal year ended May 2016

Plan FY05 / 2023

Full-year plan FY05 / 2023

Full year (million yen /%)

FY05/2022 Plan for FY05/2023
achievement Composition ratio Business forecast Composition ratio YoY
amount of sales 915,700 100.0 968,800 100.0 105.8
Gross profit 271,483 29.6 290,600 30.0 107.0
Selling costs·
General and administrative expenses
230,915 25.2 247,900 25.6 107.4
Operating income 40,567 4.4 42,700 4.4 105.3
Ordinary profit 40,052 4.4 42,571 4.4 106.3
To the shareholders of the parent company
Attribution
Net income
21,388 2.3 22,640 2.3 105.9

First half (million yen /%)

  First half of FY05/2022 First half plan for FY05/2023
achievement Composition ratio Business forecast Composition ratio YoY
amount of sales 462,512 100.0 481,700 100.0 104.1
Gross profit 136,817 29.6 144,200 29.9 105.4
Selling costs·
General and administrative expenses
114,107 24.7 122,300 25.4 107.2
Operating income 22,709 4.9 21,900 4.5 96.4
Ordinary profit 22,622 4.9 21,949 4.6 97.0
Attribution to the shareholders of the parent company
Net income
12,739 2.8 12,600 2.6 98.9

Second half

  Second half of FY05/2022 Second half plan for FY05/2023
achievement Composition ratio Business forecast Composition ratio YoY
amount of sales 453,187 100.0 487,100 100.0 107.5
Gross profit 134,665 29.7 146,400 30.1 108.7
Selling costs·
General and administrative expenses
116,807 25.8 125,600 25.8 107.5
Operating income 17,857 3.9 20,800 4.3 116.5
Ordinary profit 17,429 3.8 20,622 4.2 118.3
Attribution to the shareholders of the parent company
Net income
8,648 1.9 10,040 2.1 116.1

Outlook for store openings and closings in the FY05 / 2023

By region

2022
End of May
FY05 / 2023
Opening closed Net increase Number of stores at the end of the period
Hokkaido 422 17 14 +3 425
Tohoku 570 37 15 +22 592
Kanto Koshinetsu 520 26 12 +14 534
Chubu / Kansai 247 15 5 +10 257
China 326 24 3 +21 347
Shikoku 220 11 4 +7 227
Kyushu / Okinawa 217 21 17 +4 221
Domestic total 2,522 151 70 +81 2,603

By company

2022
End of May
FY05 / 2023
Opening closed Net increase Number of stores at the end of the period
Tsuruha 1,382 75 40 +35 1,417
Kusurino Fukutaro 232 9 4 +5 237
TGN 317 25 3 +22 339
Lady drug store 235 15 4 +11 246
Kyorindo Pharmacy 92 5 1 +4 96
B & D 73 5 1 +4 77
Drug Eleven 190 17 17 0 190
TGMD (EC Headquarters) 1 - - 0 1
Domestic total 2,522 151 70 +81 2,603

Main Initiatives in FY05 / 2023

Promotion of digital strategy

  • Building and utilizing a customer database

    1to1 marketing Implementation and case study
    ⇒ Categorization and automation of successful cases

Dispensing business strategy

  • Promotion of new station opening

    119 stores FY05 / 2023

Strengthening the group management system

  • Development of IT infrastructure
  • Building a performance management system

Sustainability promotion

  • Setting KPIs corresponding to important issues (materiality)
  • Enhancement of ESG-related information disclosure

    Information disclosure based on TCFD recommendations, etc.